The first course of Google Data Analytics, Foundations: Data, Data, Everywhere introduces concepts of data analysis process, data ecosystem and lifecycle, business context and fairness.
Data Analysis Process
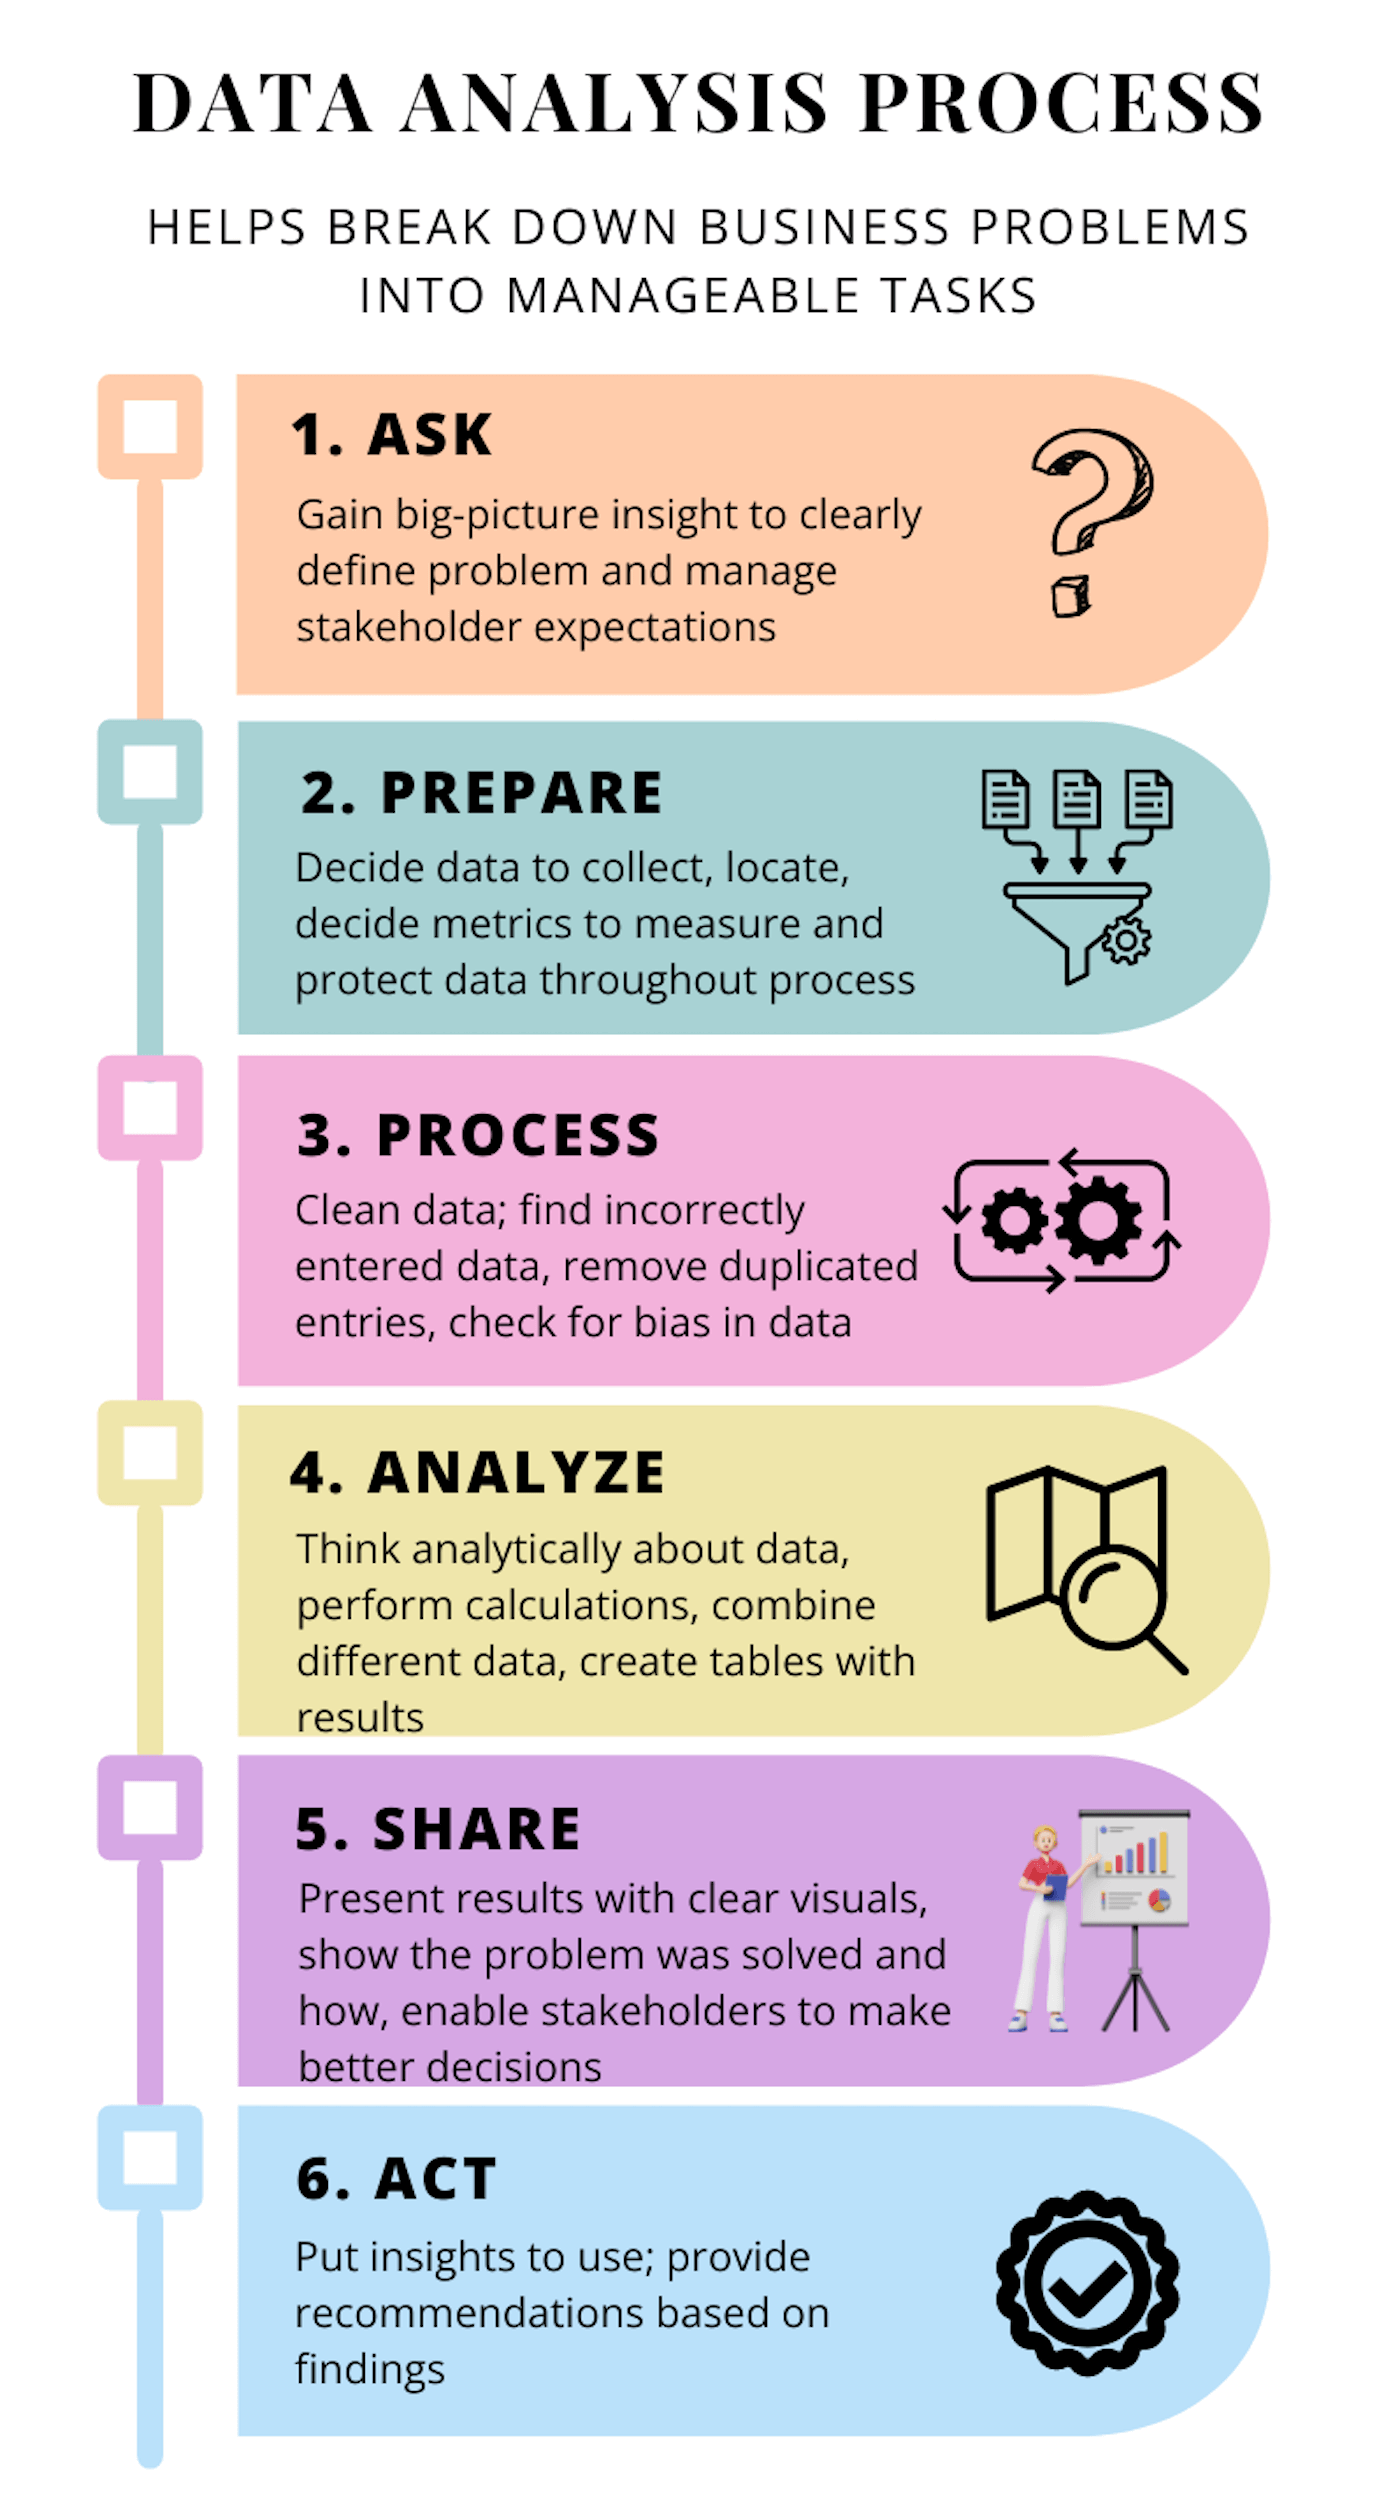
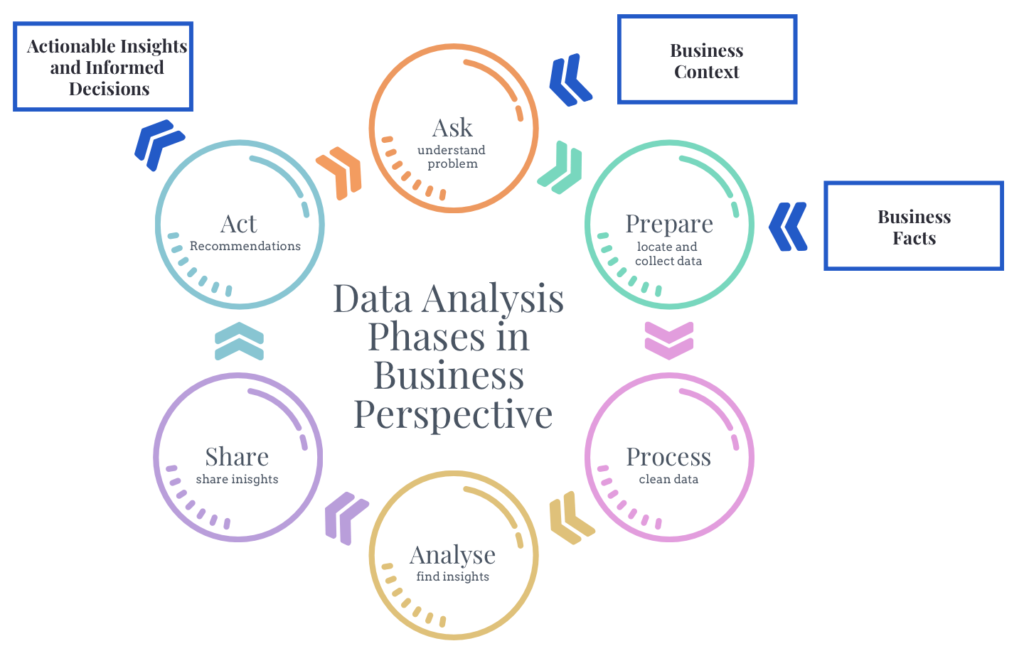
Data analysis process involves phases that a data project goes through to answer business questions (or solve problems) using data. The phases are (1) ask, (2) prepare, (3) process, (4) analyze, (5) share and (6) act. They encompass journey from asking relevant questions to understand business problem, through collecting, processing and analyzing relevant data, to sharing the insights with stakeholders and acting on those insights.

The course also introduces norms and terminologies surrounding data analytics, which are quite fundamental, Google being one of the earliest organizations to have used data for decision-making i.e. practice of using facts to guide business strategy.
Data Ecosystem and Lifecycle
Data, like the living species, resides in its own ecosystem composed of hardware and software tools, and people who use them. Data has its own lifecycle where-in it is planned, captured, managed, analyzed, archived, and subsequently destroyed.
Data is however not the most important asset when used alone.
Business Context
Data requires substantial business context for it to make the most sense and produce the most accurate insight. Business context is the qualitative information that puts behavior of data (such as trends, anomalies, correlations) in perspective. For example, extensive experience of domain experts enhances understanding of data through provision of business context. Data combined with business context generates accurate outcomes which can outperform the decisions based on mere observations and gut instinct.
Connecting Data to Reality
Data essentially is record of facts. Considering a table, each column is an attribute, and each row consists of an entry of fact (or an observation) along with its attributes.
Such data can be explored to find patterns. When combined with business context, said patterns provide real world insights. The patterns and corresponding insights can be clearly conveyed through visualization of data using charts and graphs.

(Please note that the data analysis process may not be linear in practice, in that, there may be back and forth transitions involved depending on the data. However, the progress of the process may be considered in the described order.)
Fairness
As all businesses ultimately operate in a society at large, practice of including social context along with business context in understanding data introduces fairness and avoids bias.
These are excerpts from Google Data Analytics Professional Certificate Course 1 Foundations: Data, Data Everywhere
Additional Resources:
- For detailed notes of this course, check cliff notes by Sandeep S.
- For another perspective visit Data Analytics 101 by Adith K.
This is really interesting,
And I’m so interested in learning more about Data Analytics Professional